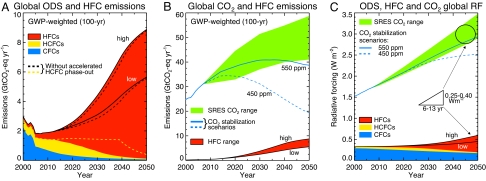
Fig. 2.
Global ozone-depleting substances (ODSs) and HFC emissions (A), global CO2 and HFC emissions (B), and ODS, HFC, and CO2 global RF (C) for the period 2000–2050. Global emissions are the total from developing and developed countries. The CFC data include all principal ODSs in the Montreal Protocol except HCFCs. The emissions of individual gases are multiplied by their respective GWPs (direct, 100-year time horizon) to obtain aggregate emissions expressed in A and B as equivalent GtCO2 per year (3). The color-shaded regions show emissions and RFs as indicated in the panel legends. The high and low labels identify the upper and lower limits, respectively, in the global baseline scenarios. The dashed lines in A show the HCFC and HFC scenario values calculated without the emission changes caused by the 2007 accelerated HCFC phaseout. Shown for reference in B and C are emissions and RF for the range of SRES CO2 scenarios and the 450- and 550-ppm CO2 stabilization scenarios (16, 17). The CO2 data from 2000 to 2007 are based on reported emissions and observed concentrations. The triangle in C shows the range of HFC RF in 2050 from the baseline scenarios compared with the range in years needed to obtain the same RF change from CO2 emissions in the SRES scenarios near 2050.

