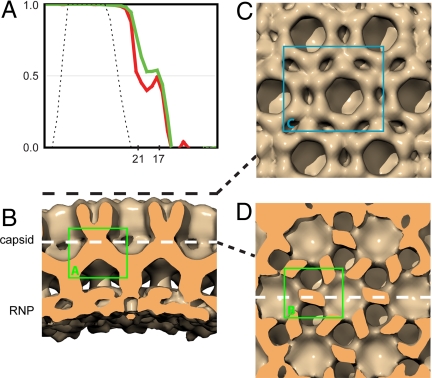
Fig. 5.
Reconstruction of in-vitro-assembled Gag particles. (A) Fourier shell correlation plot, before (red) and after (green) CTF correction. The black dotted line indicates the band-pass filter applied during the reconstruction process. The resolutions measured according to the 0.5 criterion are 21 Å before CTF correction, and 17 Å after CTF correction. (B) Surface rendering sectioned perpendicular to the particle surface. (C) Surface cut tangential to the surface at a radius indicated by the dashed black line in B, looking down on the N-CA domains. (D) Surface cut tangentially along the white dashed line in B, through the C-CA domains. Colored boxes refer to the regions illustrated in Fig. 6 A–C.

