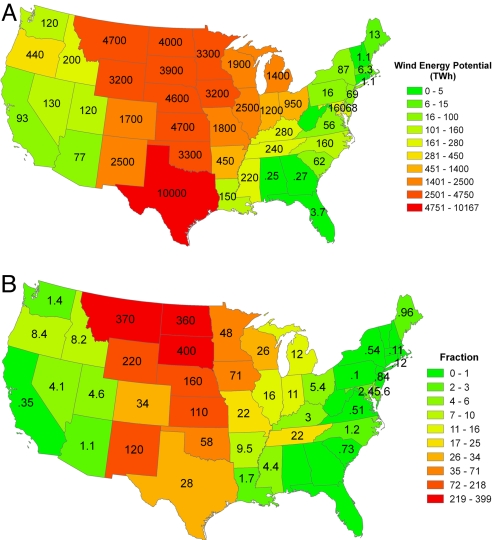
Fig. 5.
Annual onshore wind energy potential on a state-by-state basis for the contiguous U.S. expressed in TWh (A) and as a ratio with respect to retail sales in the states (2006) (B). For example, the potential source for North Dakota exceeds current total electricity retail sales in that state by a factor of 360. Data source for total electricity retail sales was www.eia.doe.gov.

