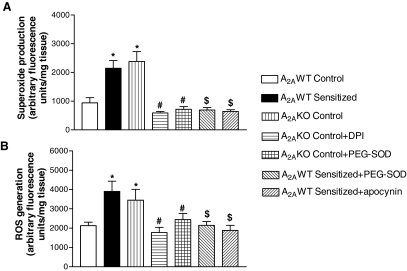
Fig. 7.
Detection of end products of NADPH oxidase activation by measuring superoxide (n = 6–8) (A) and ROS production (n = 6–8) (B) in tracheas of A2AWT control, A2AWT sensitized, and A2A KO control mice. The effect of NADPH oxidase inhibitors apocynin (10-5 M)/DPI (10-5 M) and PEG-SOD (100 U/ml) is also shown. Values are expressed as mean ± S.E.M. *, p < 0.05 compared with A2A WT control; $, p < 0.05 compared with A2AWT sensitized; #, p < 0.05 compared with A2AKO control.

