Fig. 2.
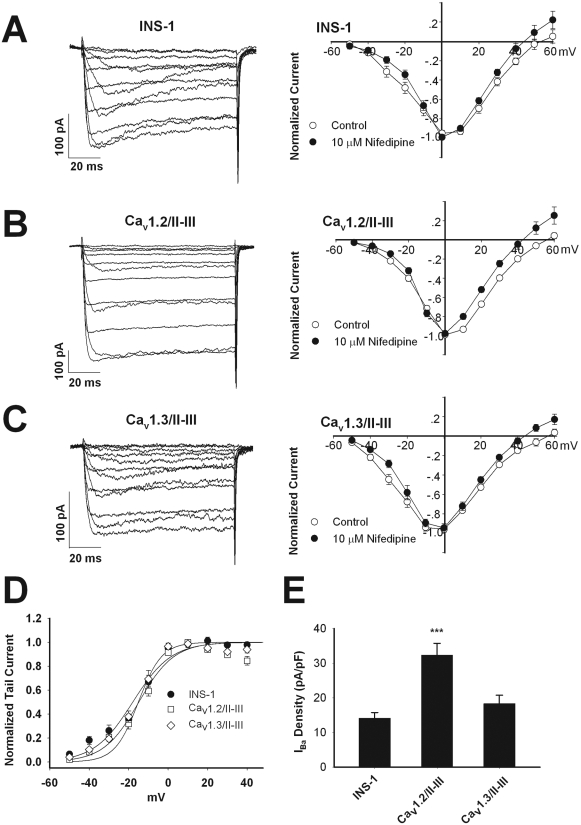
Endogenous voltage-gated Ca2+ channel activity is intact in INS-1 cells overexpressing Cav1.2/II-III or Cav1.3/II-III peptides. A to C, current-voltage relationship curves of IBa measured using whole-cell voltage clamp. Currents were elicited by 100-ms depolarizations from -50 to +60 mV in 10-mV increments, from a holding potential of -70 mV, in the absence (control, ○) or presence of 10 μM nifedipine (•). INS-1 cells (n = 10), Cav1.2/II-III cells (n = 10), and Cav1.3/II-III cells (n = 8). D, peak tail currents recorded upon repolarization to -70 mV after a 100-ms depolarization to the indicated prepulse voltage were normalized and plotted against prepulse voltage. V1/2act values were determined by fitting the data to the equation I/Imax = 1/(1 + exp[-(V - V1/2)/K]), where V is the prepulse potential in millivolts and V1/2 is the prepulse potential at which tail current amplitude is half-maximal. E, whole-cell IBa density (pA/pF) measured at 0 mV from a holding potential of -70 mV. The difference in total whole-cell current density for Cav1.2/II-III cells compared with INS-1 cells and Cav1.3/II-III cells is statistically significant. ***, P < 0.001 (n = 13–15, F = 13.9).

