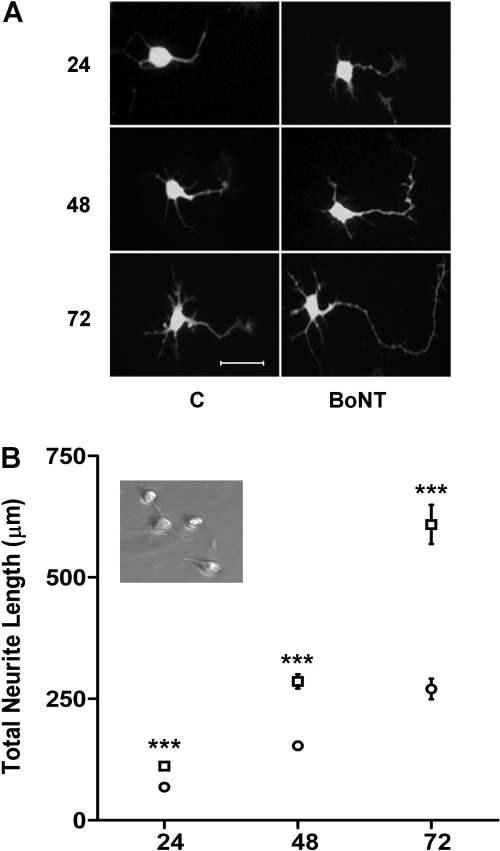
Fig. 1.
Neurite outgrowth of cultured eMNs. Comparison of a single dose of BoNT/A at three time points. A, fluorescent images of individual eMNs taken from cultures treated with 0.1 nM BoNT/A (BoNT) or without (C) for 24, 48, and 72 h. Neurons were imaged using an antibody to protein gene product 9.5. Scale bar, 50 μm. B, comparisons of total neurite length in μm (mean ± S.E.M.) between control (○, n = 30) and BoNT/A (□, n = 30)-treated neurons at 24, 48, and 72 h. ***, value is significantly different from control at p < 0.001. Inset, phase-contrast images of neurons at 4 h postplating just before treatment.

