
Figure 2. Assessment of TGF-β signaling in representative clones of V-400 after transduction with the inducible TGFBR2 transgene.
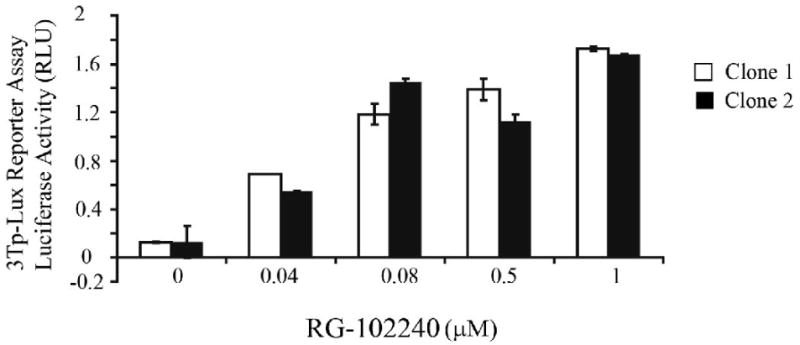
V-400R2 clones 1 and 2 display a linear dose response from 0-1.0 μM of RG-102240 with the greatest increase in 3TP-Lux activity occurring between 0 μM and 0.8 μM. 3TP-Lux activity was detected at low concentrations of RG-102240. Note that clone 1 has a wider dose-response range than clone 2.