
Figure 3. The expression of cell surface TGFBR2 in V-400 after treatment with RG-115819.
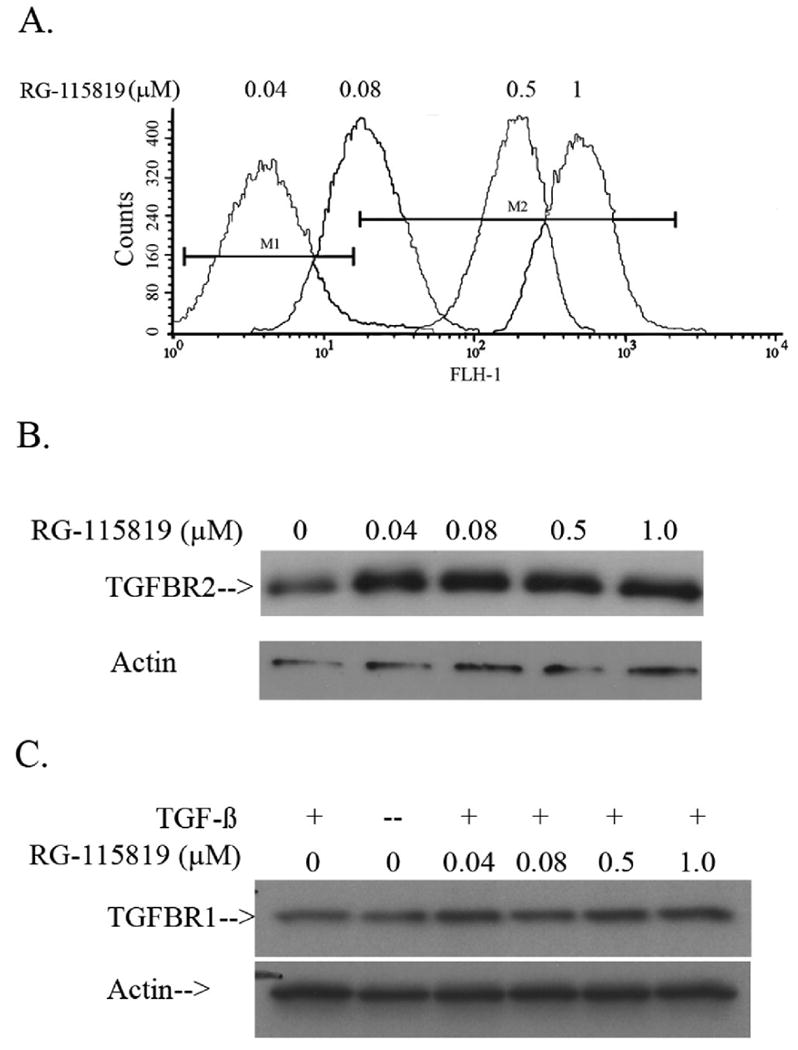
A. FACS analysis using an anti-HA antibody was performed after treatment with different doses of RG-115819 (0 μM-1.0 μM). An increased amount of cell surface TGFBR2 is detected with the increasing RG-115819 doses. M1 designates the fluorescence signal detected in the parental V-400 cell line. Of note, although no HA-tagged TGFBR2 can be detected with this technique after 0.04 μM RG-115819 treatment, as shown in figure 1, TGF-β induced gene expression is detected with this concentration of RG-115819 indicating that the transgenic receptor is present on the cell surface with this dose of RG-115819. The untreated V-400R2 clones showed the same level of fluorescence as that seen in the parental V-400 cell line. B. Immunoblotting using an anti-HA antibody was performed after treatment with different doses of RG-115819 (0 μM-1.0 μM). An increased amount of cell surface TGFBR2 is detected when comparing the untreated V-400R2 cell line to the cell line treated with the increasing RG-115819 doses although the resolution of immunoblotting does not reveal the changes in expression level as accurately as does flow cytometry. C. Immunoblotting using an anti-TGFBR1 antibody after treatment with different doses of RG-115819 (0μM-1.0μM) reveals no significant change in TGFBR1 expression with RG-115819 treatment. Expression of actin was assessed to control for protein loading.