
Figure 4. CDKN1A/p21 expression in V-400R2 cells after treatment with different concentrations of RG-115819.
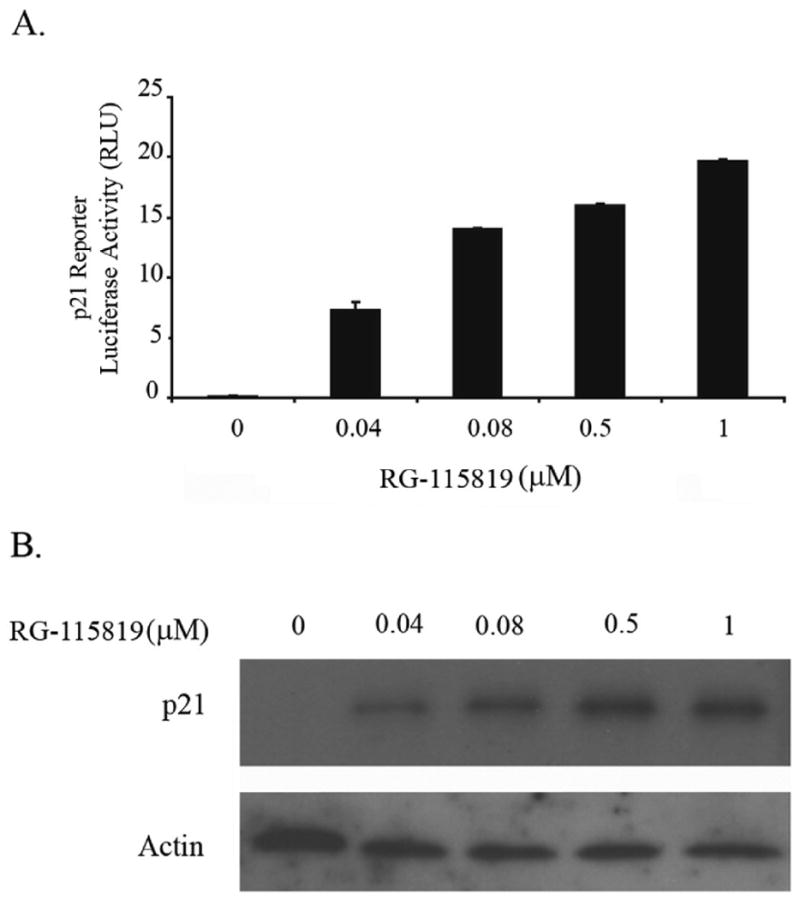
V-400R2 clone 1 was treated with four different concentrations of RG-115819 (0.04; 0.08; 0.4 and 1 μM) and then CDKN1A/p21 expression was assessed. A.CDKN1A/p21 luciferase reporter activity after 24 and 48 hours of RG-115819. Induction of CDKN1A/p21 is present at 24 and 48 hours with a linear dose-response being evident at 48 hours. B. After 48 hours of treatment with RG-115819, a dose related increase in CDKN1A/p21 protein expression is present, consistent with the CDKN1A/p21 reporter assay results. Densitometry was performed on the bands, and these results were normalized for loading using the densitometry values from the corresponding actin immunoblot. The densitometry revealed a linear increase in band density that correlated with increasing RG-115819 concentration [93 (0 μM), 90 (0.04 μM), 101 (0.08 μM), 121 (0.5 μM) and 159 (1 μM)]. Image J software (NIH) was used for the densitometry analysis.