
Figure 5. ERK and Smad activation after treatment with RG-115819 demonstrates a direct dose relation of RG-115819 to activation of both pathways.
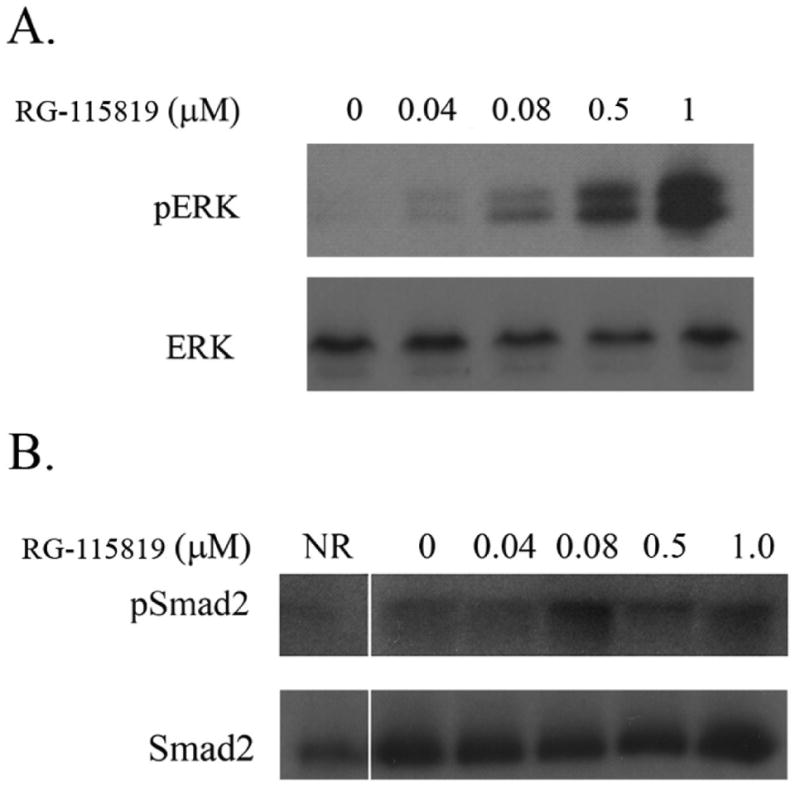
A. Immunoblotting for phosphorylated ERK1/2 (pERK) was performed on V-400R2 treated for 48 hours with RG-115819 (0 μM-1 μM). A dose-related increase in pERK in the cells is demonstrated. Total ERK levels reveal no differences with RG-115819 treatment. B. Immunoblot results of phosphorylated Smad2 (pSmad2) after 48 hours of treatment with RG-115819 also reveal a dose-related increase in the pSmad2 levels with doses greater than 0.08 μM. The amount of increase in pSmad2 is less than that observed for pERK. Densitometry was performed on the bands, and these results were normalized for loading using the densitometry values from the corresponding actin immunoblot. The densitometry revealed a linear increase in band density that correlated with increasing RG-115819 concentration [60 (0 μM), 90 (0.04 μM), 101 (0.08 μM), 121 (0.5 μM) and 159 (1 μM)]. Image J software (NIH) was used for the densitometry analysis.