
Figure 1.
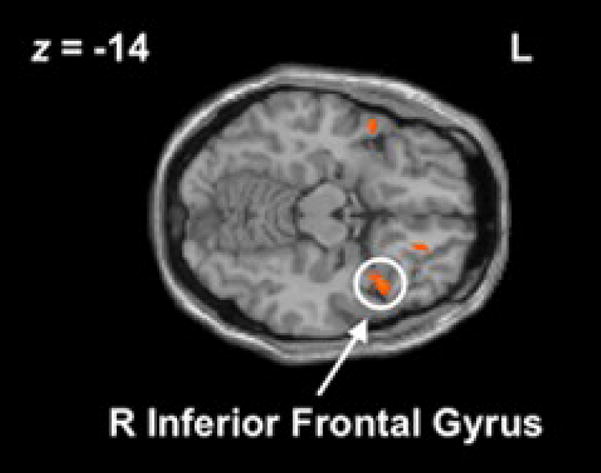
Right inferior frontal cortex (x=40, y=16, z=−18) activation observed during no-go− > go−. This region was used as a seed to identify target regions more negatively associated with rIFC during no-go− than go−.
Official websites use .gov
A
.gov website belongs to an official
government organization in the United States.
Secure .gov websites use HTTPS
A lock (
) or https:// means you've safely
connected to the .gov website. Share sensitive
information only on official, secure websites.
Right inferior frontal cortex (x=40, y=16, z=−18) activation observed during no-go− > go−. This region was used as a seed to identify target regions more negatively associated with rIFC during no-go− than go−.