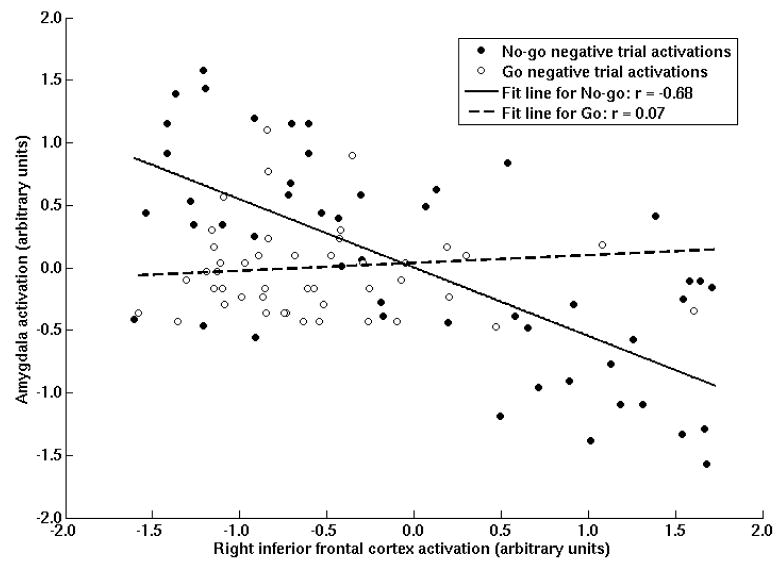
Figure 4.
An example of the inverse functional connectivity between right inferior frontal cortex (x=40, y=16, z=−18) and left amygdala (x=−26, y=−6, z=−22) for a typical subject. Here, the trial-by-trial correlation between rIFC and amygdala was −0.68 during no-go− trials and was 0.07 during go− trials. The psychophysiological analysis (PPI) is a group-level test of the difference of these betas between no-go− and go− trials.

