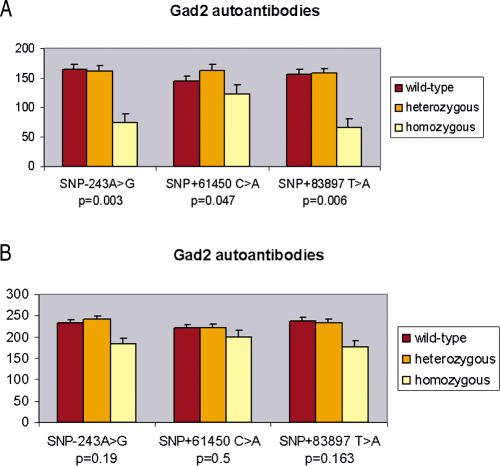
Figure 6. Ln GAD65Ab Levels Adjusted for Age and BMI According to the Genotypes at SNPs −243 A>G, +61450 C>A, and +83897 T>A.
Mean level values ± SD are displayed for each genotype. Wild-type are AA, CC, TT; heterozygous are AG, CA, TA; and homozygous are GG, AA, AA, respectively, for each SNP. (A) Nonobese normoglycemic subjects. (B) Morbidly obese patients.

