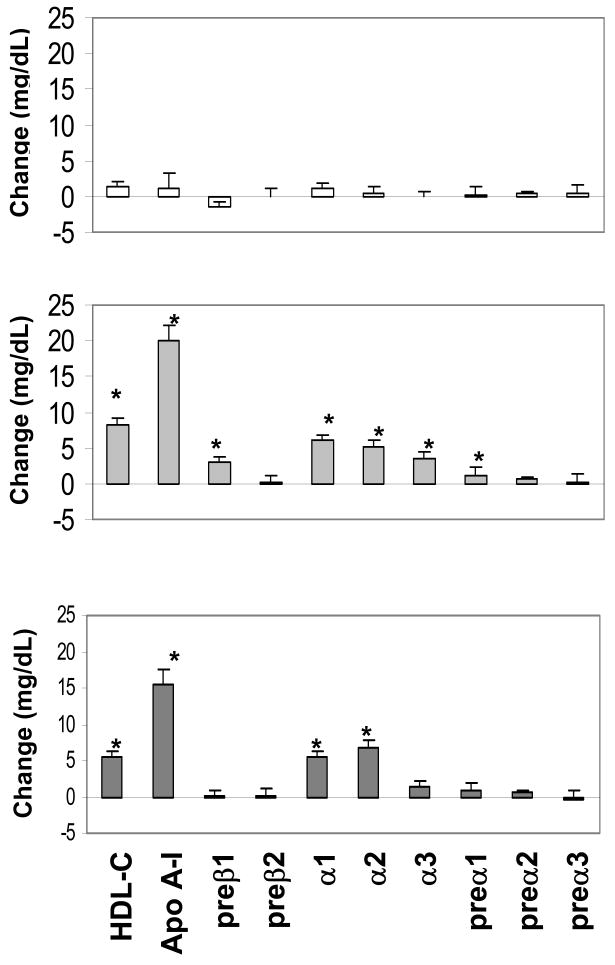
Figure 2.
Changes in plasma HDL-C, apo A-I, and HDL subpopulations in the placebo (upper panel), estrogen (middle panel), and estrogen + progestin (lower panel) arms of the ERA trial. HDL subpopulations are expressed as mg/dL of plasma apo A-I. * P<0.001, relative to changes in the placebo arm. Data expressed as mean change±SE.

