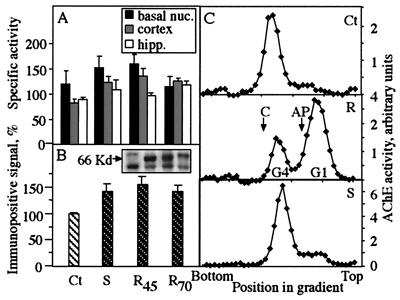
Figure 1.
Overexpression of AChE in transgenic brain. (A) AChE activity in brain regions of transgenic mice. Shown are rates of acetylthiocholine hydrolysis per min per mg of protein in homogenates of basal nuclei (basal nuc.), cortex, and hippocampus (hipp.) of AChE-S (S), AChE-R of line 45 (R45), AChE-R of line 70 (R70) transgenics, and control (Ct) mice, all from the FVB/N strain. Bars present averages ± SEM for homogenates from four or five mice of each pedigree. Note that elevation in catalytic AChE activity, although nonsignificant, is common to all transgenic lines. (B) AChE immunoreactivity in cortex of transgenic mice. Shown are average intensities ± SEM of immunopositive bands after SDS/PAGE, immunoblot, and densitometric analyses of cortical homogenates from transgenic and control mice. The antibody used was targeted against the common N-terminal domain of AChE; the positive signal obtained with this antibody in control mouse samples (see Inset) demonstrates massive cross reactivity with the mouse enzyme. Intensities were determined for the three main immunopositive bands (see Inset) from five to eight lanes loaded with protein from individual mice of each strain and are presented as percentage of control values within the same gel. Note that elevation in immunoreactivity, although nonsignificant, is common to all transgenic lines. (B Inset) An example of an immunoblot film, showing the main bands in each lane for each of the transgenics and controls at the same order as in the bar graph. Kd, kilodalton. (C) Altered multimeric assembly. Shown are sucrose gradient profiles for AChE in the cortex of control (Ct), AChE-S (S), and AChE-R (R; line 45) mice. Arrows denote the sedimentation of bovine catalase (C; 11.4 S) and alkaline phosphatase (AP; 6.1 S). Note elevation in AChE tetramers (G4; ≈10 S) or monomers (G1; ≈4.4 S) and the altered ratio between these isoforms in the different transgenics.

