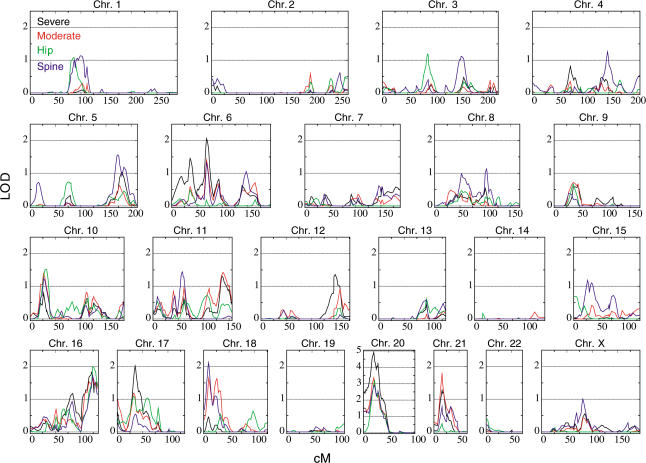
Figure 1. Framework Linkage Scan.
Framework linkage scan using 1,100 microsatellite markers for the severe (black line), moderate (red line), hip (green line), and spine (blue line) pedigree sets. The LOD score is on the y axis and the distance from the pter in Kosambi cM is on the x axis. Note that the LOD score scales are the same for all chromosomes except Chromosome 20.

