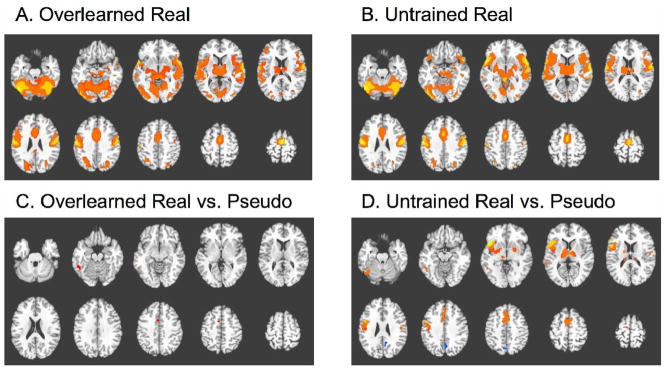
Figure 1. Main effects over all sessions.
A: Regions showing a significant response to onset of real pictures during overlearned runs. B: Regions showing a significant response to onset of real pictures during untrained runs. C: Regions showing a significantly greater response to real pictures relative to pseudo pictures during overlearned runs (see Table 1A). D: Regions showing a significantly greater response to real pictures relative to pseudo pictures during untrained runs (see Table 1B). All montages shown depict 10 axial slices, ranging from z = −20 to z = +61, in increments of 9mm (except for figure 1C, which ranges from −25 to +56). Colors are scaled from red to yellow reflecting the relative magnitude of activation (or dark blue to light blue for negative activations). See Methods for thresholding information.

