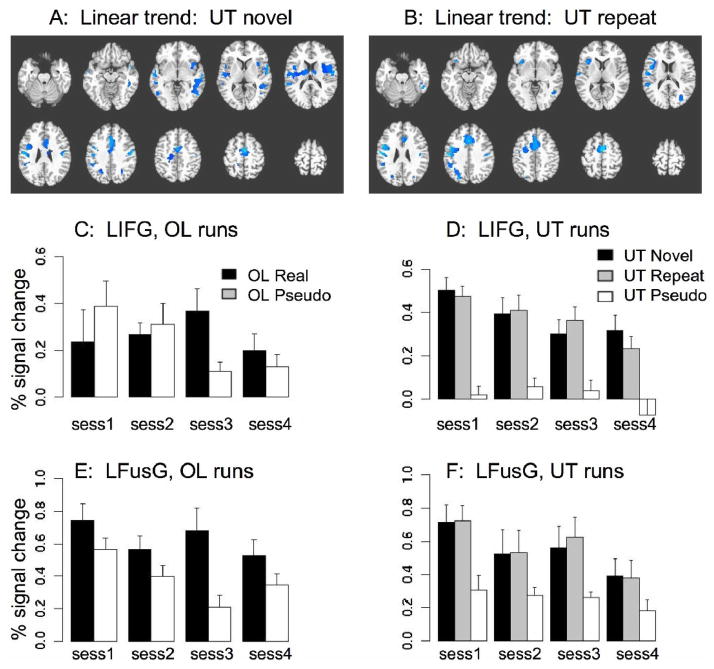
Figure 2. Trends of activation changes across sessions.
A: Regions showing a significant negative trend in activation magnitude for novel items in untrained (UT) runs across the four sessions (see Methods). No positive trends were seen. Slice locations are identical to figure 1. B: Regions showing a significant decline in activation magnitude for the repeated set of pictures in untrained runs across the four sessions. The sets of regions showing a decline for novel and repeated items are similar but not identical; however, no voxels exhibited a significant difference in the rate of decline for novel vs. repeated pictures. (Note that in the first session, all pictures are effectively novel). C: Activation magnitude for overlearned (OL) real and pseudo pictures across the four sessions, in Left Inferior Frontal Gyrus. Values are percent signal change from a spherical ROI of radius 8mm, averaged over voxels and subjects, centered at Talairach coordinates −37, +13, 0. D: Activation for the LIFG ROI in untrained runs across four sessions, for novel real pictures, repeated real pictures, and pseudo pictures. Note that all pictures are actually novel in the first session – the repeated set are repeated during the subsequent sessions. E: Activation in the left fusiform gyrus (LFusG) for overlearned runs. ROI coordinates −45, −55, −18. F: Activation in the left fusiform gyrus for untrained runs.

