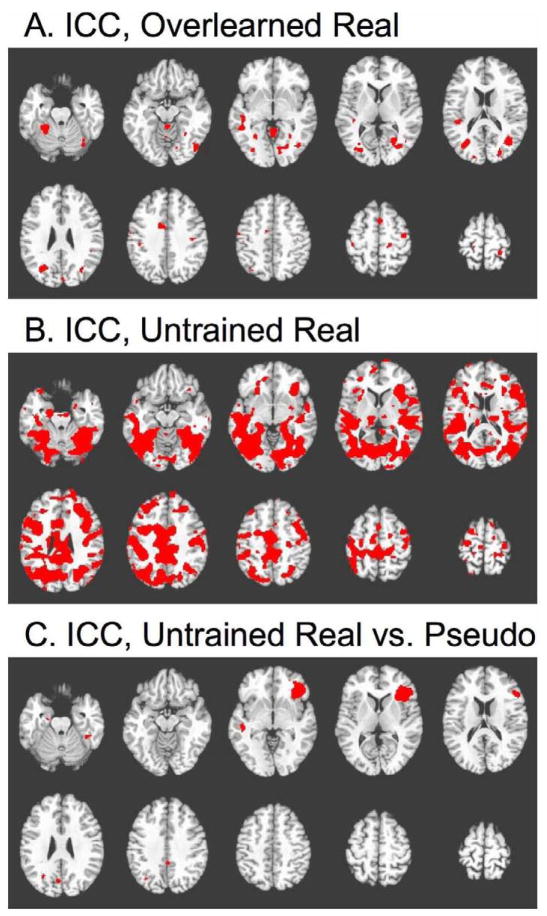
Figure 3. Reliability across sessions.
All maps depict the Intraclass Correlation Coefficient (ICC) at each voxel (see Methods), binary thresholded at a value of 0.7, indicating high reliability of an individual subject’s activation magnitude across multiple scanning sessions. Slice locations are identical to figure 1. A: ICC for responses to overlearned real pictures. B: ICC for untrained real pictures. C: ICC for the subtraction of untrained real vs. pseudo pictures.

