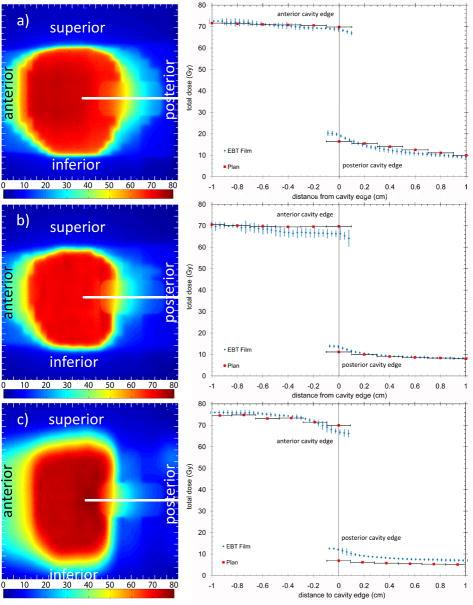
Figure 3.
Sagittal digitized film images and resultant dose profiles for a) 3DCRT b) IMRT and c) helical tomotherapy (HT) delivery techniques. The colour bar is in absolute dose in Grays. All measurements were scaled to represent the dose delivered over the total treatment (28 fractions). The error bars are the standard error of three measurements.

