Fig. 2.
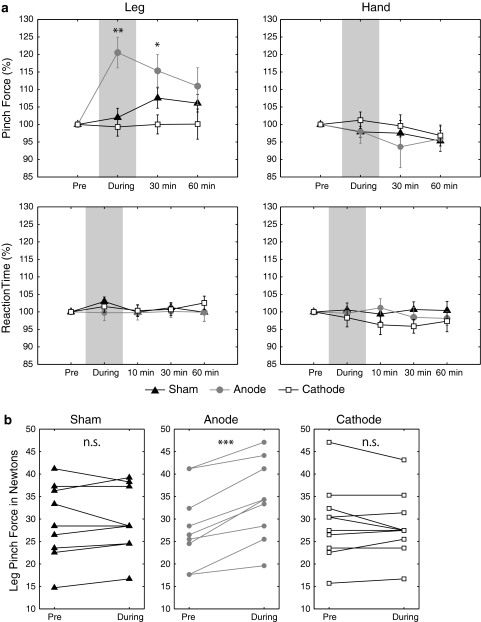
a Results showing the effect of tDCS on PF and RT tasks. Mean performance is plotted as a function of time relative to the intervention, with bars indicating SEM (*P < 0.05, **P < 0.01). Leg PF (left upper), leg RT (left lower), hand PF (right upper), Hand RT (right lower). The data are normalized with respect to baseline value before the intervention. Anodal tDCS (grey circle) significantly increased the maximal PF during its application and 30 min after stimulation compared to baseline. Neither cathodal (white rectangle) nor sham (black triangle) stimulation changed the maximal PF, and neither anodal nor cathodal significantly affect on leg RT, hand PF or hand RT. b Individual results for maximal leg PF. Each of the plotted values plot is an individual maximal PF before or during tDCS application. Anodal tDCS increased the PF maximal in all subjects, and neither cathodal tDCS nor sham stimulation affected PF consistently across subjects (***P < 0.001)

