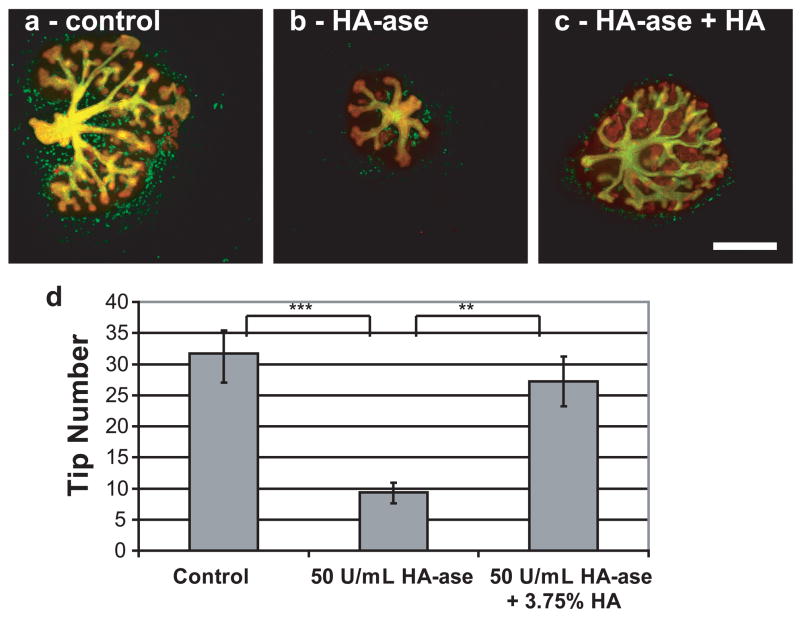
Figure 2. Whole embryonic kidney with or without hyaluronidase.
(green = DB lectin, UB derived tissues; red = E-Cadherin, UB and MM derived epithelial tissues) (A) Control, (B) 50 U/mL hyaluronidase, (C) 50 U/mL hyaluronidase + 3.75% HA (MW = 234.4 kDa). (D) Plot of tip number vs. condition (ANOVA, P ≤ 0.05). Tip number measurements of each condition after 7 days of in vitro culture. ** = P ≤ 0.005, *** = P ≤ 0.0005. Scale bar corresponds to 500 μm.

