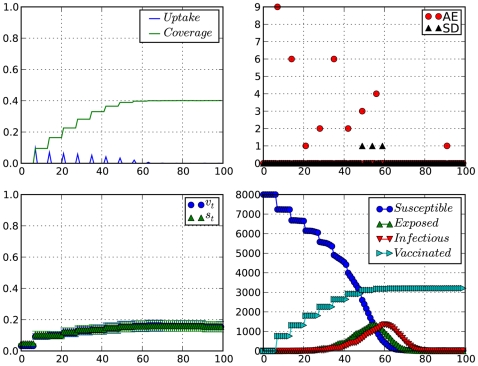
Figure 2. Impact of occurrence of adverse vaccination events at the beginning of a vaccination campaign.
Top-left: vaccination coverage and vaccine uptake (×8000 doses);top-right: adverse vaccination and serious disease events; Bottom-left: willingness to vaccinate ( ) and perceived vaccine safety (
 ); Bottom-right: Epidemiological time-series. Time is in weeks.
  .
.

