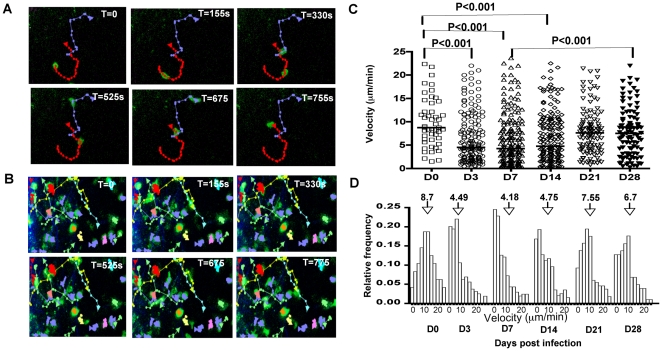
Figure 2. Antigen dependent reduction in OTGFP cell velocities during Toxoplasma infection.
A) Tracks followed by OT1GFP cells during a given imaging session (total time = 755 s) in the mesenteric lymph node of an uninfected mouse. The OT1GFP cells are shown in green and the tracks generated by these cells are shown in red and purple. B) T cell tracks from mice infected with PruOVA (D3 post infection) during an imaging session lasting 755 s. The OT1GFP cells are shown in green and the cell tracks are represented in multiple colors C) The mean migratory velocities of the imaged cells at the different time points post infection. Each symbol corresponds to a tracked T cell and bars indicate median velocity of the populations. P values were calculated using Kruskal-Wallis test. D) The frequency of the OT1GFP cells moving at various velocities as a function of the total imaged cells, at the different time points post infection. Arrows point to the median velocity of each population.

