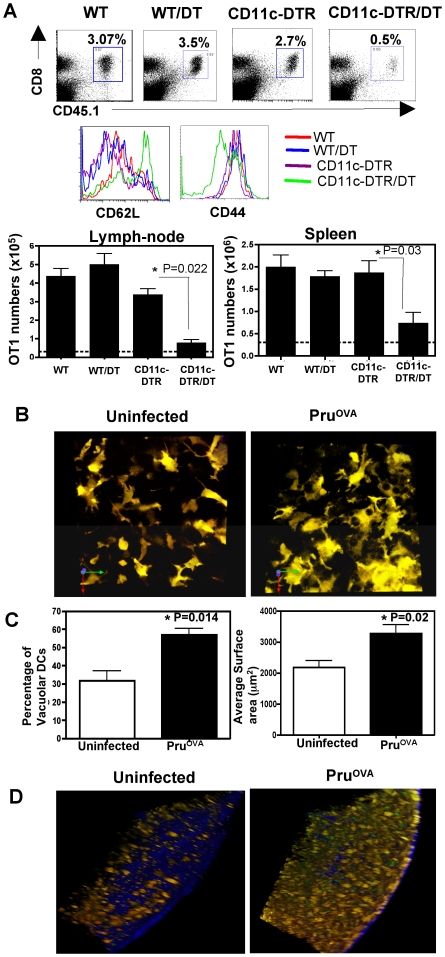
Figure 5. Role of DCs during infection with Toxoplasma.
A) The percentages of OT1GFP cells (CD45.1+CD8+) in WT or CDllc-DTR transgenic mice that were infected (day 5-post infection) with PruOVA with or without treatment with DT (100 ng/mouse ip). The CD62L and CD44 levels on the OT1GFP cells (CD45.1+CD8+T cells) present in the lymph nodes of mice from the various treatment groups. The average OT1 numbers from spleen and pooled lymph nodes of 3 mice per group is shown in the lower panels. The line represents the average OT1 numbers in uninfected WT mice. Similar results were obtained in a separate experiment. B) Maximum focus images of z stacks (21 µm) from draining lymph nodes of CD11cYFP mice that were either uninfected or infected (PruOVA) 3 days prior. C) The average number of vacuolar DCs and the average surface area of the DCs in infected and uninfected groups. D) 3D projections of 150 µm z stacks from lymph nodes of CD11cYFP transgenic mice that were adoptively transferred with OT1GFP T cells and were either uninfected or infected with PruOVA (day 3-post infection).

