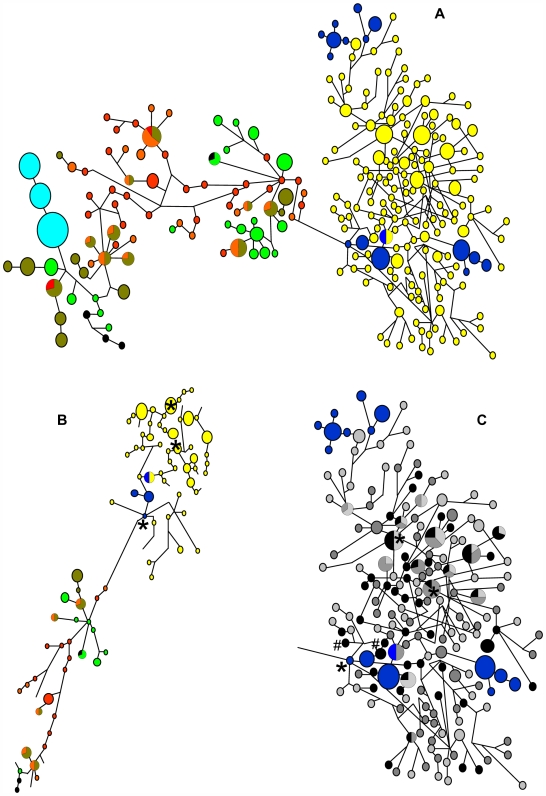
Figure 2. Networks of phylogenetic relationships among ancient and extant mitochondrial DNA haplotypes.
(A) Median-joining network where the size of the circle indicates relative frequency of the haplotype. Yellow – Victoria Land Coast (VLC); dark blue – Macquarie Island (MQ); brown – Falklands; orange – Elephant Island; green – Marion Island; light blue – Peninsula Valdés; red – South Georgia; black – Heard Island. South Georgia and Heard Island relationships are based on 240 bp of mtDNA (see Materials and Methods). Networks were post-processed to reduce complexity using the Maximum Parsimony option in Network 4.5 [13]. (B) Network showing torso only, illustrating major connections among basal haplotypes. Image has been rotated to fit the page. Samples coloured as in part ‘A’. Likely VLC founder haplotypes, based on rho (ρ) estimates, indicated by ‘*’. (C) MQ and VLC clade only, illustrating relationship between MQ haplotypes and the age of the VLC samples. Blue: MQ; light gray: VLC<1500 YBP; dark gray: VLC 1501–3000; black: VLC 3000+. Likely VLC founder haplotypes, based on rho (ρ) estimates, indicated by ‘*’. Nearest VLC neighbours of the proposed VLC-founder haplotype (sampled from MQ) indicated by ‘#’.

