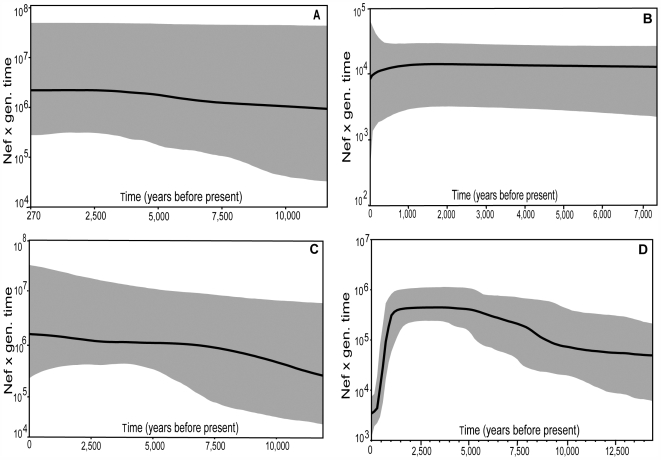
Figure 4. Bayesian skyline plots of effective population size change through time.
The black line indicates the median posterior effective population size through time. The gray lines illustrate the 95% HPDI, taking into account coalescent model and phylogenetic uncertainty, for: (A) VLC alone; (B) MQ alone; (C) VLC and Marion Island combined; (D) VLC and MQ combined.

