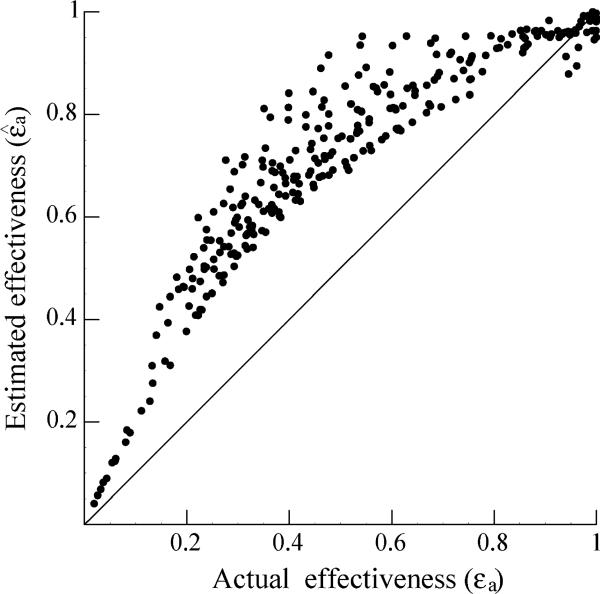
Fig. 2.
The average of estimated effectiveness, , obtained by fitting the CE model to the surrogate data plotted against the average of actual effectiveness, εa, used to generate the data. Each point corresponds to the estimate obtained from analyzing one data set. Solid line indicates the ideal situation . Data points above the line indicate that the average estimates are larger than the actual average effectiveness.

