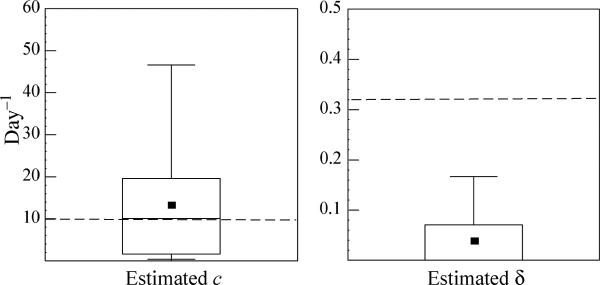
Fig. 3.
Estimates of the viral clearance rate, and the infected cell loss rate, , obtained using the CE model. Dashed lines indicate the true values of c (9.9 day−1) and δ (0.32 day−1). The horizontal lines within the boxes denote the medians (c = 10.1 day−1 and δ = 0 day−1, which for δ is the same as the minimal value), while the lines at the bottom and top of the boxes show 25 and 75% quartiles, respectively. The whiskers show the 10 and 90% percentiles. Squares in the boxes denote the estimated averages (c = 13.2 day−1 and δ = 0.04 day−1).

