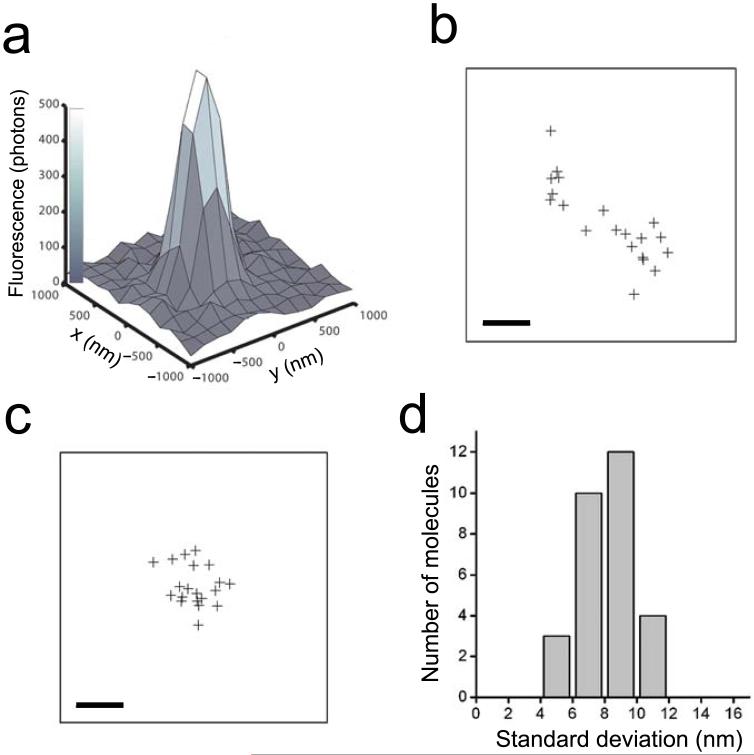
Figure 2.
The high localization accuracy of individual switches during each switching cycle defines the intrinsic resolution of STORM. (a) The point spread function (PSF) of the emission from a single switch on DNA during a single switching cycle. Fitting the PSF to a 2-dimensional Gaussian (not shown) gives the centroid position of the PSF. (b, c) The centroid positions of an individual switch determined in 20 successive imaging cycles before (b) and after (c) correction for sample drift. Scale bars: 20 nm. (d) A histogram of the standard deviation of centroid positions. The standard deviation is determined as (σx + σy)/2 for each switch using 20 imaging cycles, where σx and σy are the standard deviations of the centroid positions in the x and y dimensions. This histogram was constructed from 29 switches.

