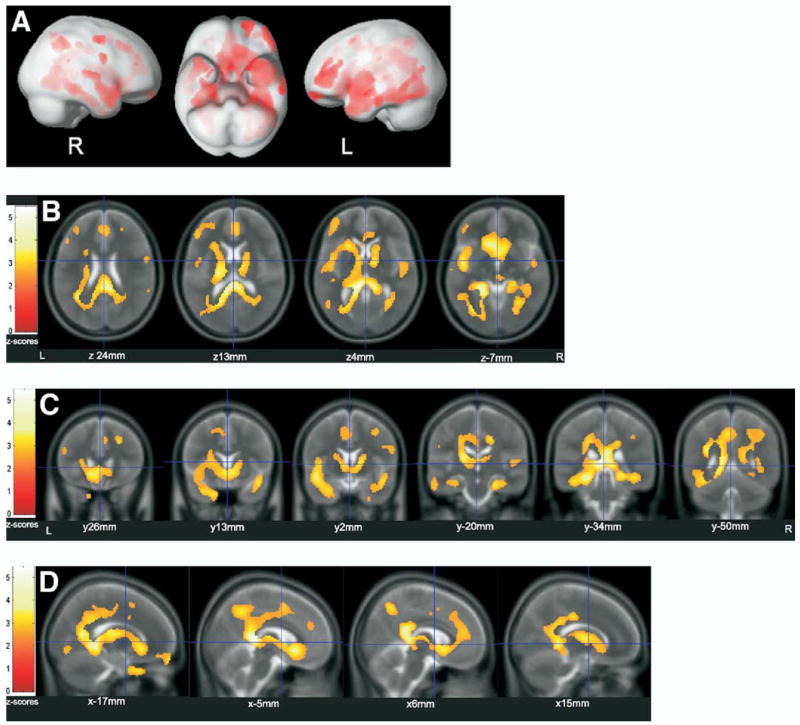
Figure 3.
Voxel-based regression analysis between [11C]PiB uptake and CSF Aβ42. Significant (p < .01) associations: (A) projected to the surface; (B–D) overlaid on T2-scans (average of 152 scans, implemented in SPM2). (B) axial, (C) coronal, (D) saggital. Aβ42, beta amyloid [1-42]; [11C]PiB, carbon-11-labeled Pittsburgh Compound B; CSF, cerebrospinal fluid; L, left; R, right; x/y/z, coordinates of slices in Talairach space.

