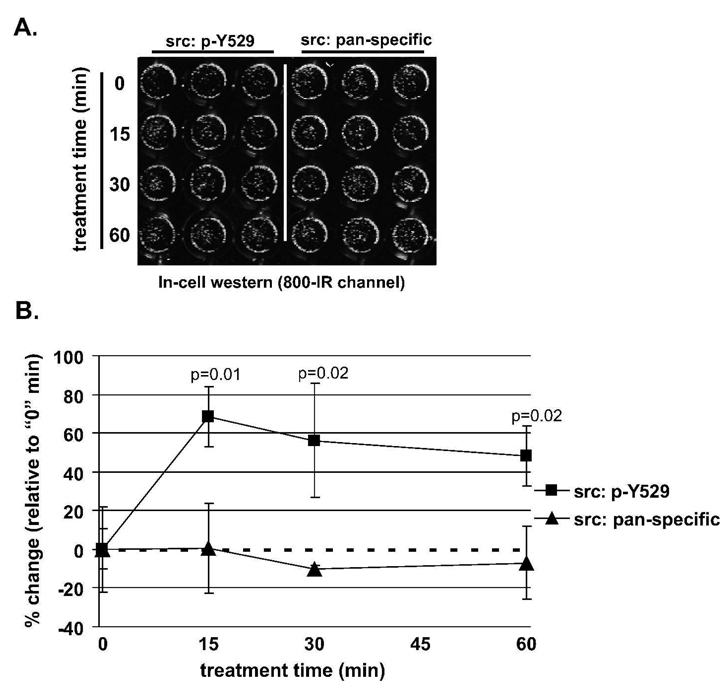
Figure 5.
PTL increases src phosphorylation at tyrosine 529 in CD44hi tumor-initiating DU145 cells. (A) Representative image of an In-cell western assay for src activity. PTL treatment times (0, 15, 30 and 90 min) are indicated on the left side. The left panel indicates phosphorylation of src at tyrosine 529 (p-Y529), a measure of its activity and the right panel shows total src expression (pan-specific). Note that the green color was artificially generated to illustrate immunostaining image acquired from the infrared (IR) dye. (B) Quantitation of the In-cell western assay for src activity. Percent changes were calculated as fold changes relative to untreated control (0 time point) and presented as mean ± SD. The signal intensities for p-Y529 and pan-specific src were normalized to TO-PRO-3 iodide fluorescence (not shown). P-values (n=3) compare percent changes of p-Y529 with percent changes of pan-specific src.

