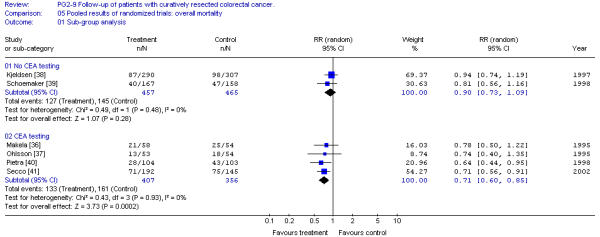
Figure 2.

Pooled results of randomized trials: overall survival sub-group analysis. [No CEA testing; CEA testing]. Overall relative risk ratio, no CEA testing = 0.90 (95% CI, 0.73 to 1.09; p = 0.28)Overall relative risk ratio, CEA testing = 0.71 (95% CI, 0.60 to 0.85; p = 0.0002)
