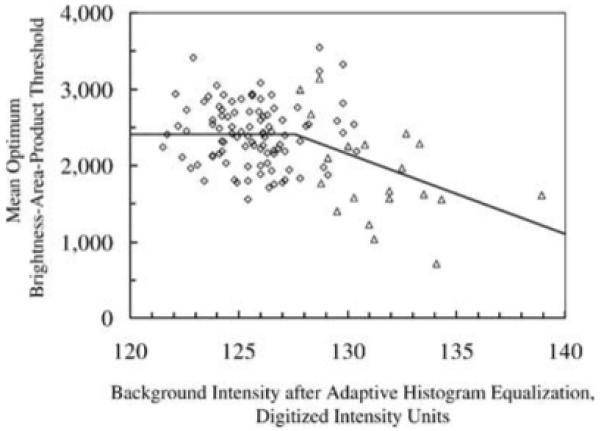
Fig. 3.

Relationship between mean optimum brightness-area-product threshold () and mean background intensity after adaptive histogram equalization (). Each marker represents the mean across all frames in a scan. The solid line represents the relationship that was used to determine the for a particular scan when was calculated from the images. When was less than 128, was constant (2411), and otherwise it was equal to x m1 + b1 (Eq. 4), where m1 and b1 are given in Table 3. The coefficients m1, b1, and the transition intensity changed after March 1, 1999 (data shown were from scans after this date).
