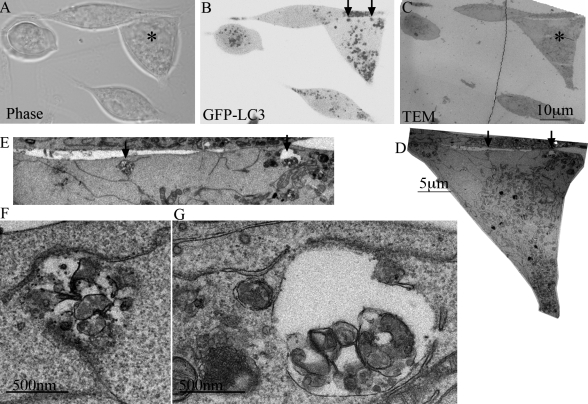
Figure 4.
Correlative light-electron microscopy analysis of GFP-LC3 puncta demonstrates they are AVs. (A) Phase, (B) fluorescent, and (C) TEM of the same field of 293/GFP-LC3 cells 48 h after siRNA depletion of α-COP. In B the image was inverted to allow better visualization of the GFP-LC3–positive structures. (D) Higher magnification of cell shown with asterisk in A and C. Top region of cell of interest is enlarged in E to show the two AVs structures indicated by arrows in B. (F and G) Higher magnification of AVs shown by arrows in E.

