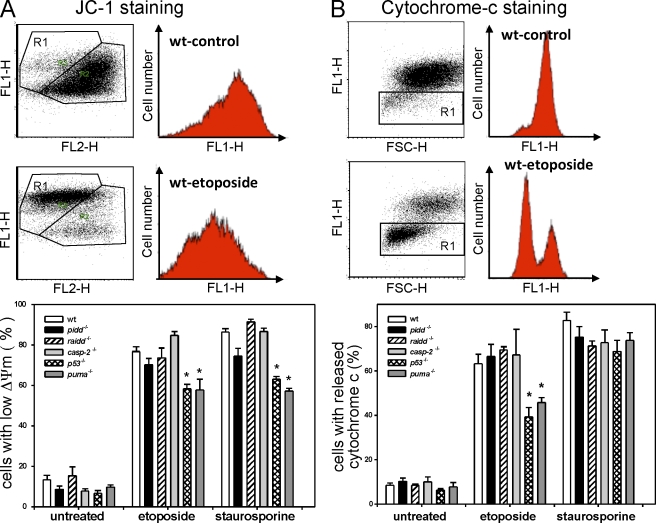
Figure 4.
Impact of PIDDosome loss on mitochondrial function and cytochrome c release. (A) Mitochondrial membrane potential was determined by JC-1 staining, and representative FACS blots of control and etoposide-treated SV40-immortalized MEFs are depicted. The bar graph shows quantification of FACS analysis using JC-1 staining of SV40-immortalized MEFs of the indicated genotypes 24 h after treatment. (B) Cytochrome c release was monitored in untreated or etoposide- or staurosporine-treated SV40-immortalized MEFs after 24 h by flow cytometric analysis. Representative FACS blots of control and etoposide-treated SV40-immortalized MEFs are depicted. The bars represent the percentage of cells that released cytochrome c. (A and B) The bar graphs represent the means ± SEM of n ≥ 3 independent experiments per genotype and treatment. *, P < 0.05 compared with wild type (wt).

