Figure 7.
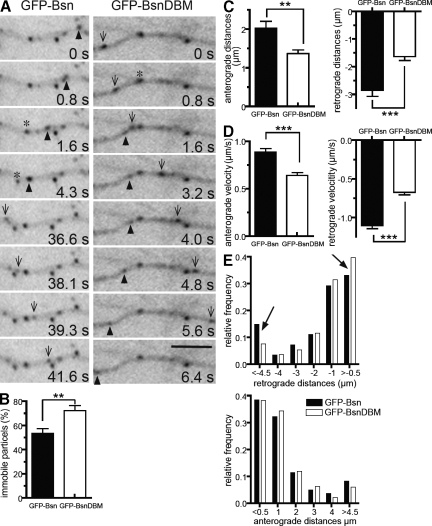
Axonal trafficking of GFP-Bsn– and GFP-BsnDBM–labeled transport packets. (A) Axonal segments of 5-DIV neurons transfected 2 d earlier with GFP-Bsn or GFP-BsnDBM. Both GFP-Bsn and GFP-BsnDBM move in both directions (arrowheads and arrows). Asterisks indicate an initially immobile fluorescent particle. (B–D) Graphs showing comparisons of immobile particles (B) and running distances (C) and velocities (D) of anterogradely and retrogradely moving particles in cells transfected with either GFP-Bsn or GFP-BsnDBM. Error bars indicate SEM. **, P < 0.01; ***, P < 0.001. (E) Relative distribution plot of running distances of GFP-Bsn and GFP-BsnDBM in retrograde and anterograde direction. Note the increased fraction of short retrograde movements (>−0.5) and the decreased fraction of long retrograde movements for GFB-BsnDBM compared with GFP-Bsn (arrows). In all graphs, shaded bars represent GFP-Bsn, and open bars represent GFP-BsnDBM. Bar, 5 µm.

