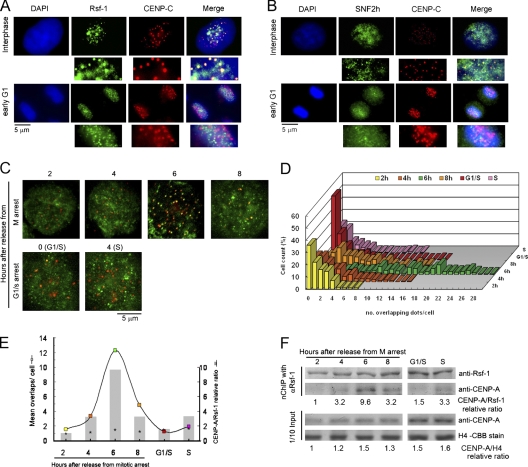
Figure 2.
Rsf-1/RSF transits centromeres in middle G1. (A and B) Immunolocalization of Rsf-1 (A, green) and SNF2h (B, green) regarding centromeres recognized by anti-CENP-C antibodies (red). DAPI (blue) was used for DNA staining. The enlarged insets show clear overlapping and nonoverlapping. (C) HeLa cells synchronized at G1 at 2, 4, 6, and 8 h after release from TN16-induced mitotic arrest; G1/S border at 0 h and S phase at 4 h after release from thymidine block were coimmunofluorescent stained using mouse monoclonal antibody against anti-Rsf-1 (green) and rat monoclonal antibody against CENP-A (red). (D) Quantification of Rsf-1 and CENP-A overlapping signals in each of the 100 cells evaluated per interphasic time-point. (E) Interaction of Rsf-1 with CENP-A is maximal at 6 h after release from mitotic arrest. The colored boxes show results from D as the mean number of Rsf-1 and CENP-A overlapping signals per cell for each interphasic stage (n = 1). Shaded bars show the relative ratio of CENP-A to Rsf-1 recovered after nChIP with anti-Rsf-1 antibody from F, of the cells synchronized as in C (n = 1). Asterisks show relative ratio of CENP-A to histone H4 of input samples in F (n = 1). (F) Cell cycle dependency of association of the Rsf-1/RSF complex with CENP-A chromatin. Bulk chromatin of approximately 3 × 10⁸ HeLa cells synchronized as in C was extensively digested with MNase (4,000 U/ml x min) and subjected to nChIP using anti-Rsf-1 antibody. The relative amounts of CENP-A to Rsf-1 were determined on immunoblotted membrane by densitometer tracing of the bands and drawn in E as shaded columns. Input bulk chromatin fractions (one-tenth of nChIP sample) were separately run on two duplicate gels, one transferred to a membrane and probed for CENP-A, and one stained with Coomassie Brilliant blue to visualize histone H4. The amounts of CENP-A relative to histone H4 in input samples were measured and depicted as asterisks in E. Relative molecular mass of Rsf-1 or CENP-A is ∼250 kD or ∼17 kD, respectively.

