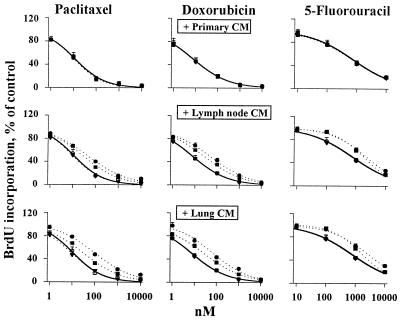
Figure 1.
Induction of drug resistance in monolayer cultures by CM. CM of primary (Top), lymph node (Middle) and lung (Bottom) tumor cultures. Control with no CM, ○; histoculture CM, ●; CM of early monolayer culture (passage 0); ■; CM of late monolayer culture (passage 3), ▾. Similar results were obtained for rat (shown here) and human PC3 tumor cells. The curves for CM of primary tumor cultures and late monolayer metastatic tumor cultures overlap with the control curves.

