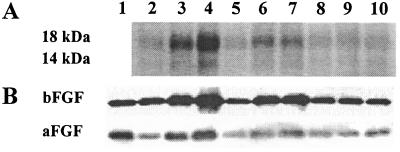
Figure 2.
Analysis of proteins in tumor CM. (A) Higher concentrations of 14-kDa and 18-kDa proteins in the active CM compared with the inactive CM. Lanes 2–4, histocultures of primary, LN, and lung tumors, respectively; lanes 5–7, early monolayer cultures (passage 0) of the same tumors; lanes 8–10, late monolayer cultures (passage 3) of the same tumors. (B) Immunoblotting with mouse anti-human aFGF and bFGF mAbs. Lane 1, r-aFGF (20 ng) or r-bFGF (5 ng). Lanes 2–10, same as in A.

