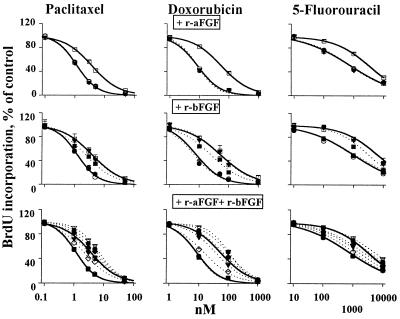
Figure 3.
r-aFGF and r-bFGF, independent of CM, induced drug resistance. Two controls: no CM (left solid curves, ○); CM of lung histocultures (right solid curves, □). (Top) r-aFGF. Amounts of 1 (●), 10 (■), and 50 (▾) ng/ml. All three dotted curves overlap with the left control curve. (Middle) r-bFGF. Dotted curves from left to right: 1 (●, overlaps with the left control curve), 10 (■), and 50 (▾, overlaps with the right CM-control curve) ng/ml. (Bottom) r-aFGF/r-bFGF combinations. Dotted curves from left to right: 0.04 and 1 ng/ml (■, overlaps with the left control curve); 0.08 and 1 ng/ml (◊); 0.16 and 1 ng/ml (▾); 0.32 and 1 ng/ml (⧫); 0.64 and 1 ng/ml (●); and 1 ng/ml each (▿). Similar results were obtained in human PC3 (shown here) and rat tumor cells.

