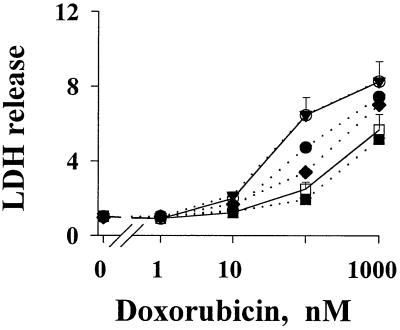
Figure 4.
FGF-induced resistance to cell kill by drugs. Drug-induced cell death in PC3 cells was monitored by the activity of LDH released to the culture medium. Results are expressed as a ratio of treated samples to untreated controls. Values for control samples varied by less than 10%. (Top to Bottom) Without CM or FGF (○); 0.9 ng/ml r-aFGF (▾, overlaps with the top control curve); 0.9 ng/ml r-bFGF (●); 0.16 ng/ml r-aFGF plus 0.9 ng/ml r-bFGF (⧫); CM of lung tumor histocultures (□); 0.9 ng/ml r-aFGF plus 0.9 ng/ml r-bFGF (■). Similar results were found for doxorubicin (shown here), paclitaxel, and 5-fluorouracil.

