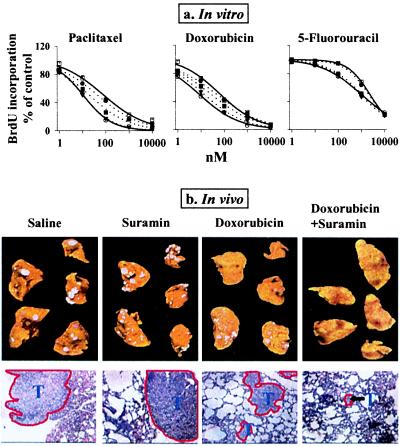
Figure 5.
Enhancement of drug effect by suramin. (a) In vitro. Two controls: no CM, no suramin (left solid curves, ○); CM of lung histocultures, no suramin (right solid curves, □). Dotted curves from right to left, suramin 5 μM (●); 10 μM (■); and 15 μM (▾). Similar results were obtained for rat (shown here), human PC3, and PC3-LN tumor cells. The IC50 of doxorubicin in PC3-LN cells was 17 nM. (b) In vivo. (Top) Visible tumors on the ventral and dorsal surfaces of the lungs in all animals in the control and single agent groups, no visible tumors in most animals in the combination group. (Bottom) Histologic sections (×100), with tumors outlined in red.

