
Figure 4.
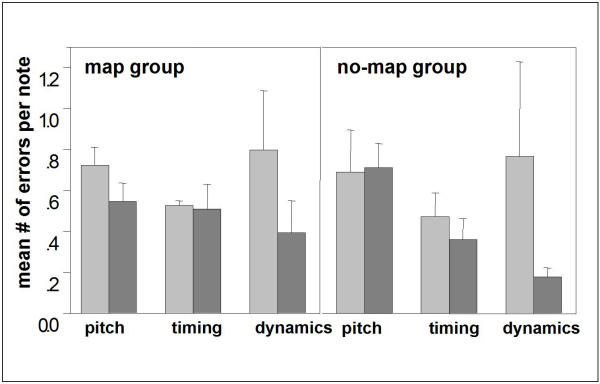
Average error incidences per note Average error incidences per note of a given melody, divided into pitch errors (note order only), timing errors and dynamics errors. The values of the 'map' group (n = 9) are displayed on the left, those of the 'no-map' group (n = 8) on the right. In each case, the left bar (light gray) dates from the first training session and the adjacent right one (dark gray) from the last session (session 11).