
Figure 5.
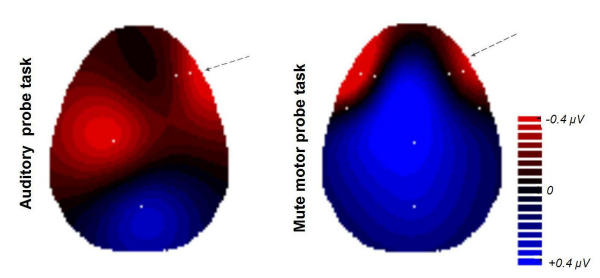
Changes of cortical activity induced by 10 sessions of training. Changes of cortical activity induced by 10 sessions of training. Shown are all inter-group-differences between the 'map' group and the 'no-map' group for an electrode selection (white dots) where the two groups differed significantly (P < 0.05). The electrode positions C3 (auditory probe task) and F10 (both task types) differed highly significant (P < 0.01) between the two groups. Topographic mapping results from two-dimensional 4-neighbors interpolation. RED: Areas where the training-induced changes are more pronounced in the 'map' group than in the 'no-map' group, with respect to cortical activation (i.e., more negative potentials). BLUE: Areas unaffected or inhibited due to the practice, in the 'map' group compared to the 'no-map' group.