
Figure 6.
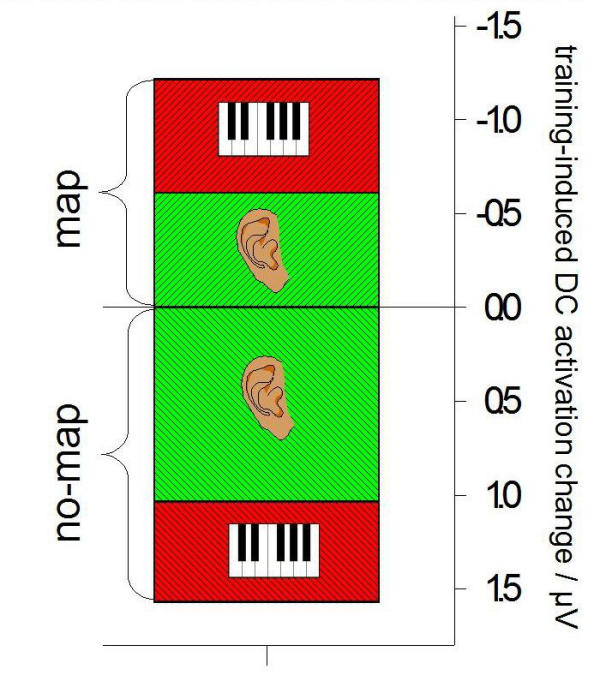
Changes of cortical activity induced by 10 sessions of training. Activation changes for a right fronto-temporal selection of electrode sites (F8, F10, FT8, FT10, and T8). Tiled box plot. Green bars relate to the passive auditory task, red bars to the silent movement condition. Error bars not displayed; the differences within one condition are highly significant (P < 0.01).