
Figure 5.
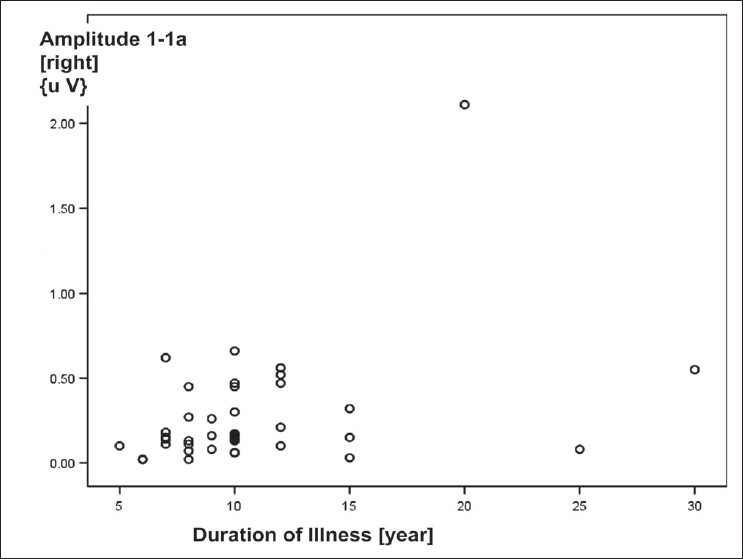
Scattered plot diagram showing a positive correlation was seen between duration of illness [due to COPD] and amplitude of wave I-Ia of BAEP wave pattern recorded over right ear in COPD patients
Official websites use .gov
A
.gov website belongs to an official
government organization in the United States.
Secure .gov websites use HTTPS
A lock (
) or https:// means you've safely
connected to the .gov website. Share sensitive
information only on official, secure websites.
Scattered plot diagram showing a positive correlation was seen between duration of illness [due to COPD] and amplitude of wave I-Ia of BAEP wave pattern recorded over right ear in COPD patients