Figure 6.

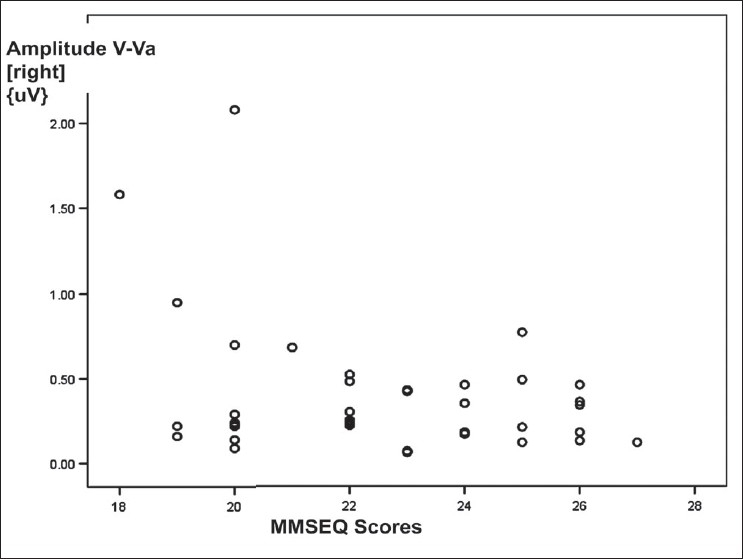
Scattered plot diagram showing a weak negative correlation between Mini–Mental Status Examination Questionnaire scores and amplitude of wave V-Va of BAEP wave pattern recorded over right ear in COPD patients

Scattered plot diagram showing a weak negative correlation between Mini–Mental Status Examination Questionnaire scores and amplitude of wave V-Va of BAEP wave pattern recorded over right ear in COPD patients