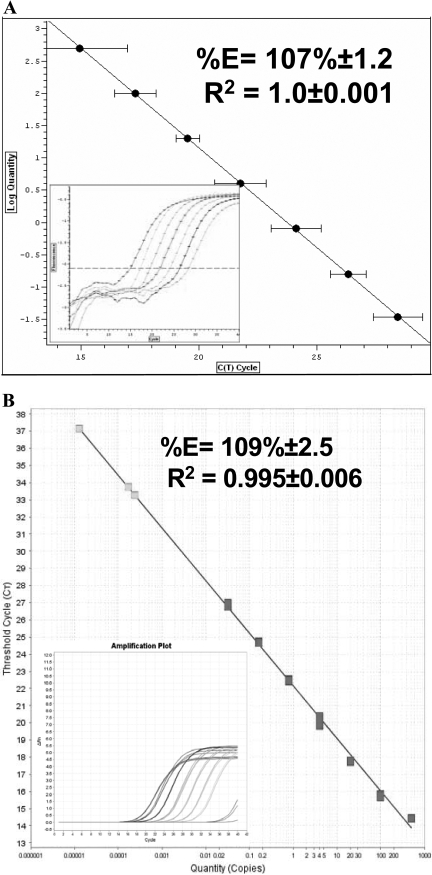
FIGURE 3.
Efficiency and linearity of Power SYBR® Green RNA-to-CT™ 1-Step kit. (A and B) The linearity of standard curves generated using GAPDH as a reference gene. Seven samples containing fivefold serial dilutions of GAPDH in amounts ranging from 500 ng to 3.2 pg were assayed on BR (A) and AB (B) PCR machines. (Insets) Graphs show the amplification plot of the standard curves, which were performed on BR and on AB, respectively.

