Figure 1.

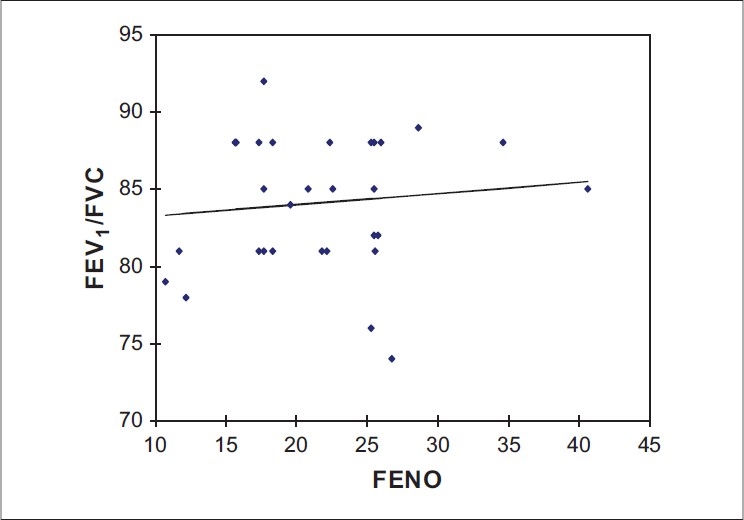
Linear regression analysis showing relationship between FEV1/FVC ratio and FENO levels in healthy subjects (r = 0.1079, P = 0.5633)

Linear regression analysis showing relationship between FEV1/FVC ratio and FENO levels in healthy subjects (r = 0.1079, P = 0.5633)